

QiVisor Box — collection and analysis of data about the efficiency of the production line
QiVisor box — Server Application
It is a simple tool that combines online visualization, the accuracy of the collected data and KPI analysis, performed immediately for any period of time.
The QiVisor Box is a reliable, efficient and сost-effective technical solution at the same time.
The QiVisor Box includes

Visualization of production lines
Data analysis of KPI, OEE
Manual data entry about downtime, products, shifts
Reports
Sensors — production counters

Local server

PLC (Controller)

Application “QiVisor”

The system includes
ONE LINE — ONE SENSOR
— QiVisor Box — main client application
— QiVisor Box Collector — Windows service for reading data from the controller and recording to databases on the SQL server
PROGRAM MODULES OF THE SYSTEM
— Database on SQL server
— A program for an industrial controller that processes input signals and short-term storage of the received data in the controller
Система регистрирует простои основываясь
только на сигнале одного дискретного датчика.
Как правило, это датчик продукта, установленный
на самой медленной машине из всего оборудования производственной линии.
только на сигнале одного дискретного датчика.
Как правило, это датчик продукта, установленный
на самой медленной машине из всего оборудования производственной линии.
To explain the reasons of stopping a slow machine, it is necessary to find out the root cause of the downtime, so that means considering the equipment of the whole line and external factors.
The downtime of the slowest machine can be the result of the downtime of other machines or the result of external causes (no materials, no energy carriers, etc.).
The system registers downtime based on the signal from only one discrete sensor. Typically this is the product sensor installed on the slowest machine in the production line. The downtime of the slowest machine is the downtime of the whole line.
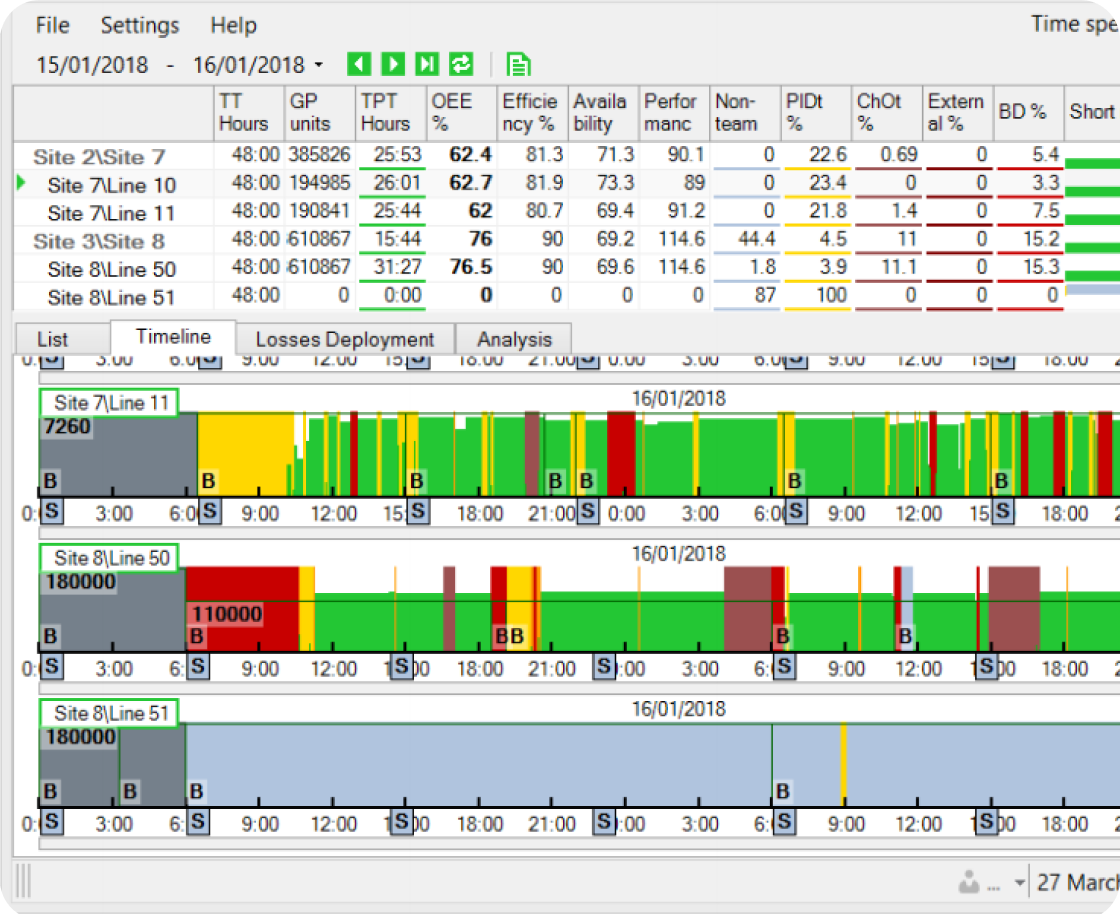
DATA COLLECTION

Tracking the fulfillment of the set goals
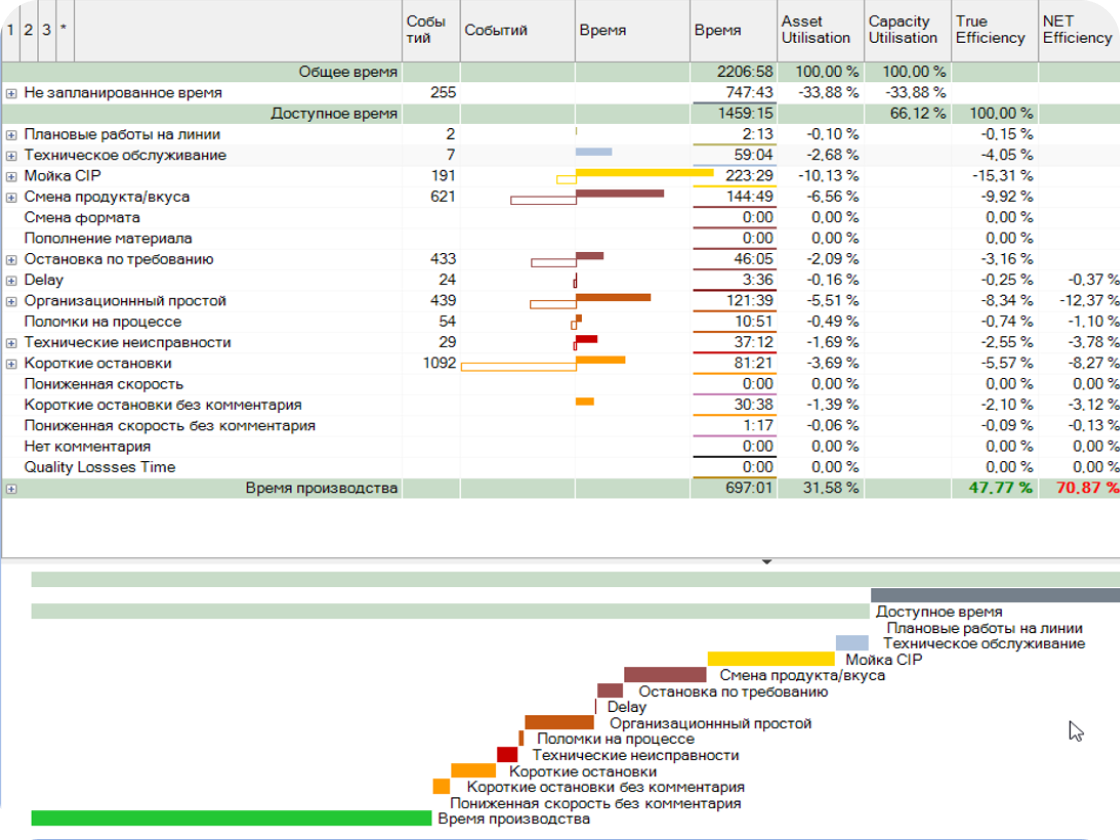
Sorting and filtering data by types of equipment downtime, units, parts
Comparative analysis by day, week, month, quarter, year
All long-line downtimes for more than one minute is automatically logged in the database
The content of the counters is transferred from the controller to the database on the SQL server
The signal from the product sensor is converted into production quantities and downtimes. This data is continuously recorded on the industrial controller, which also serves as an intermediate offline data store for a period of four days to four weeks
Reporting in Excel for all lines

The first sheet with a complete list of all KPIs for each line without detailing by time intervals and any other parameters

One sheet with a complete list of downtimes for each line

One sheet with detailed KPI analysis for each line
Feel free to ask us any questions and take your production to the next level!
Want to know more?
© All Rights Reserved.
META SYSTEMS LLC
META SYSTEMS LLC